
2009.09.15
GIC Weekly Report for the Arctic Region Vol.7
Sea ice extent reaches minimum and freezing begins
Topic of the Week
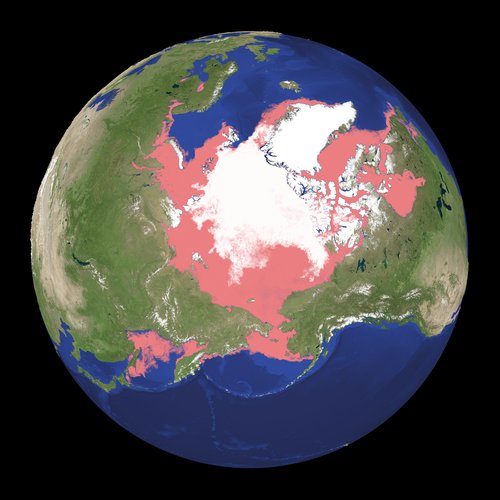
Figure 1. AMSR-E imagery of the maximum and minimum sea ice extents for 2009 (click to enlarge)
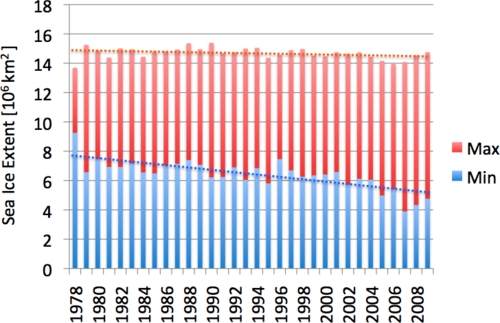
Figure 2. Graphics showing the maximum and minimum sea ice extents between 1978 and 2009 (click to enlarge)
Although there is now little hope of the Arctic passages revealing themselves to vessels this year, melting is still occurring. This week, themselves Canadian Arctic West, within the North Western passage, sea ice continued to decline to the south east of the Prince of Wales island, although to the north of the island there has shown to be an accumulation of ice, this has resulted in the Global Ice Center suggesting that only ice strengthened ships should travel through this region. The North Eastern passage depicts a similar image with sea ice around the Taimyr peninsula refusing to yield resulting in the passage staying closed.
Figure 1 shows the sea ice extent maximum and minimum for this 2009. Sea ice extent within the Arctic reached its maximum this year on the 5th March, where it reached 14.8 x 10⁶km2. This proved to be an normal maximum sea ice extent when compared to maximum sea ice extents over the previous decades, although maximum ice extents have not been affected by climate change as shown in figure 2. Minimum sea ice extent however have seemed to be affected by climate change as figure 2 shows a declining trend in minimum sea ice extent since records began. In 2009 the minimum sea ice extent was reached on the 9th September in which the sea ice extended just 4.76 x 10⁶km2. Although this was not a record, as was predicted at the start of the year, it was still the third lowest sea ice extent level since satellite observational records began in 1978.
Sea Ice Extent
|
Arctic Western Arctic Eastern Arctic |
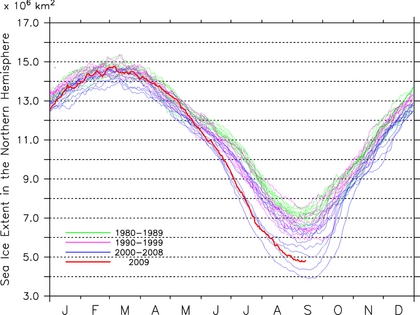
Figure 3. Sea ice extent of the entire Arctic, western Arctic and eastern Arctic. (click to enlarge)
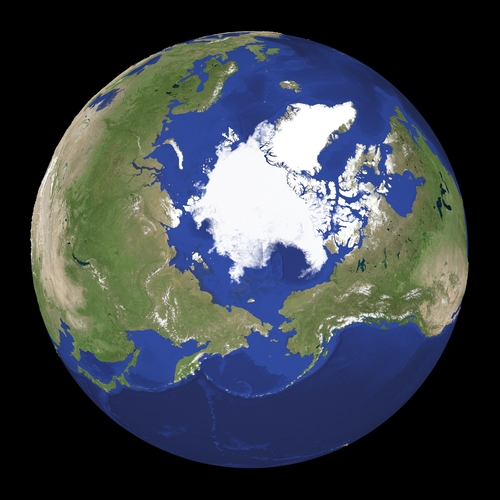
Figure 4. Satellite imagery of Arctic region. (click to enlarge)
Figure 3 shows that the sea ice extent for the Northern Hemisphere is recorded to be the third lowest recorded within historical records. The North Western and North Eastern passages are recorded to be the third lowest sea ice extent. The North Eastern passage is shown to reach its minimum later than the North Western so is still decreasing. Figure 4 shows the extent of ice over the Arctic region the current extent is only 4.83 million km2.
Sea Ice Conditions along Polar Routes
| NW Passage |
| Gulf of St.Lawrence |
Grand Banks |
Labrador Sea |
Davis Strait |
Baffin Bay |
Canadian Arctic E |
Canadian Arctic W |
Beaufort region |
Chukchi | Bering West |
| IF | IF | IF | IF | IF | IF | IF | IF | IF | |
| Greenland Sea SW |
Foxe Basin |
||||||||
| IF |
| NE Passage |
| Bering West |
Chukchi | East Siberian |
Laptev | Kara Sea N |
Barents Sea NE |
Barents Sea S |
Barents Sea NW |
| IF | IF | IF | IF | IF | IF | IF | |
| Kara Sea S |
|||||||
| IF |
| Ice Concentration | Passage situation | |
| equal or more than 7 |
ships can not sail without icebreaker | |
| 4-6 | ice-strengthend ships can sail | |
| less than 3 | ice-worthy ships can sail | |
| IF | Ice Free | normal ships can sail |
Table. Sea ice extent for each region in the Arctic, showing the labelled colors to indicate navigable routes around the North Eastern and North Western passages.
Both passages remain closed and may not completely open this year. Sea ice in the North Western passage has continued to melt between the Prince of Wales and Somerset island and is now down to 1-3/10th ice concentration of old ice around the coast of Somerset Island, although 4-6/10th of ice has accumulated to the north east of the Prince of Wales island effectively changing this passage from a yellow to an orange meaning that only ice strengthened ships can travel through this area. Foxe Basin has also continued to melt with most areas clear except for a 4-6/10th ice concentration blocking the connecting route between Foxe Basin and Boothia Bay. Other areas in the North Western passage remain clear. The North Eastern passage continues to bear sea ice at the Taimyr peninsula, effectively making this passage closed for vessels. MODIS imagery has shown that ice is present around the Severnaya Zemlya and the adjacent islands blocking any route through the Laptev sea. All other areas within the North Eastern passage remain clear.
Model Prediction
The Global Forecasting Model indicates that the Taimyr peninsula will experience air temperatures of 0°C to -5°C over the next week, this will result from arctic air masses moving Southerly towards this the Taimyr peninsula, although sea surface temperatures will remain around 0°C suggesting that melting may continue for a short period. The North Western passage temperatures will be around -5°C to -10°C these temperature will result from a northerly wind bringing cold air from higher latitudes too much of the Canadian Arctic region. Sea surface temperatures will be between -1°C and -2°C suggesting that the summer melting period is now over in this passage. Observations have shown that currently snow is falling at Cornwallis Island within the Canadian Arctic West.
The Weathernews I-SEE engine indicates that the majority of sea ice will migrate towards the Taimyr peninsula for the first half of the month before being influenced by Transpolar drift and the Beaufort gyre, this will result in the sea ice moving and accumulated in the Greenland Sea. Sea ice will also migrate towards the Beaufort sea over the next month, this will be accompanied by freezing. By mid month ice concentrations will increase around the western side of the Prince of Wales island suggesting that melting within this passage is now over.
Note-The Weathernews I-SEE engine indicates that both passage are already open although it is clear that this is not the case, this is because this models initial conditions are based on AMSR-E satellite data which is known to have a problem identifying ice formations near the edge of the ice.
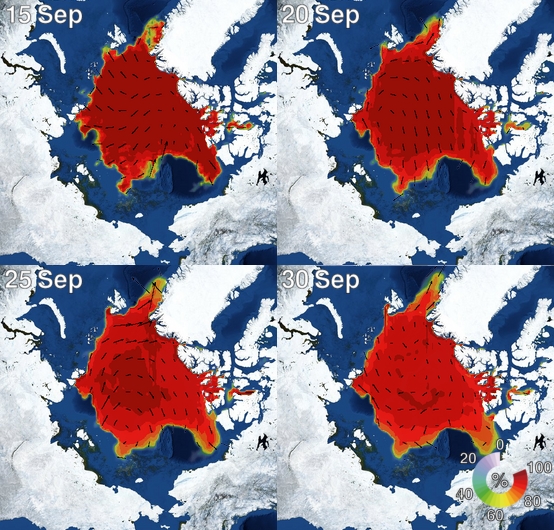
Figure 5. I-SEE engine, model predictions of Arctic sea ice.