
2011.09.06
2011 GIC Weekly Report Vol.5
Arctic Sea Ice Expected to Increase Soon
Topics of the Week
Last week we reported that a Japanese commercial vessel began a voyage through the Northeastern passage. Currently, the calm weather conditions in the Arctic Sea continue, and the vessel is expected to complete transit of the passage in about a week's time. Commercial voyages activity in the Arctic Sea will continue to become more common in the near future, but what about ice trends?
High-pressure dominating the center of the Arctic Sea and low pressure distributed along coastal areas means that ice melted and flowed easily. However, the pressure pattern forecast for this month will inhibit the flow of ice.
Figure 1 shows the summer season transition of the ice extent from 2007 to 2011. The ice transition for 2011 represented by the dotted line is a prediction calculated using the Global Ice Center's proprietary I-SEE Engine model. From this graph, we can see that this week is the lowest point for 2011. For a brief period, the minimum ice extent reached the record levels seen in 2007, but after that they remain almost the same. So at this point, we can say that the chance of an even lower minimum ice extent than 2007 is low. However, since the ice is not really moving, there is a good chance that the northeast/northwest passage will remain unhindered by ice for a while longer, and the current state of navigability will continue.
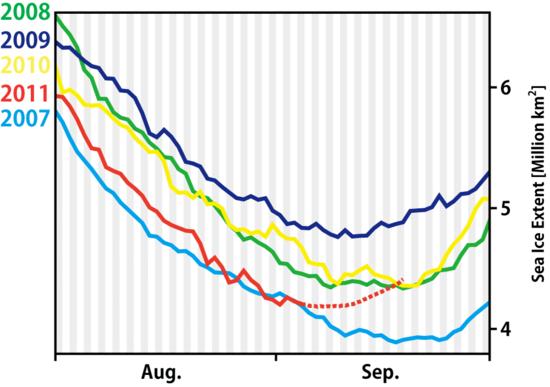
Fig.1:Progression of ice coverage from 2007 to 2011. Solid lines indicate measured values, dotted lines represent predicted values.
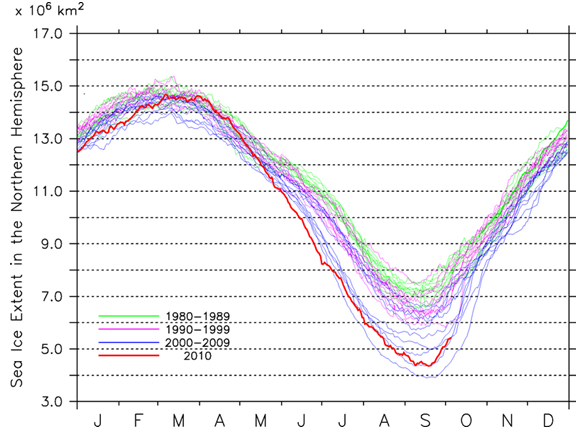
Sea Ice Extent
|
Arctic Western Arctic Eastern Arctic |
Figure 2a-2c. Sea ice extent of the entire Arctic(2a), western Arctic(2b), and eastern Arctic(2c).(Click to expand)
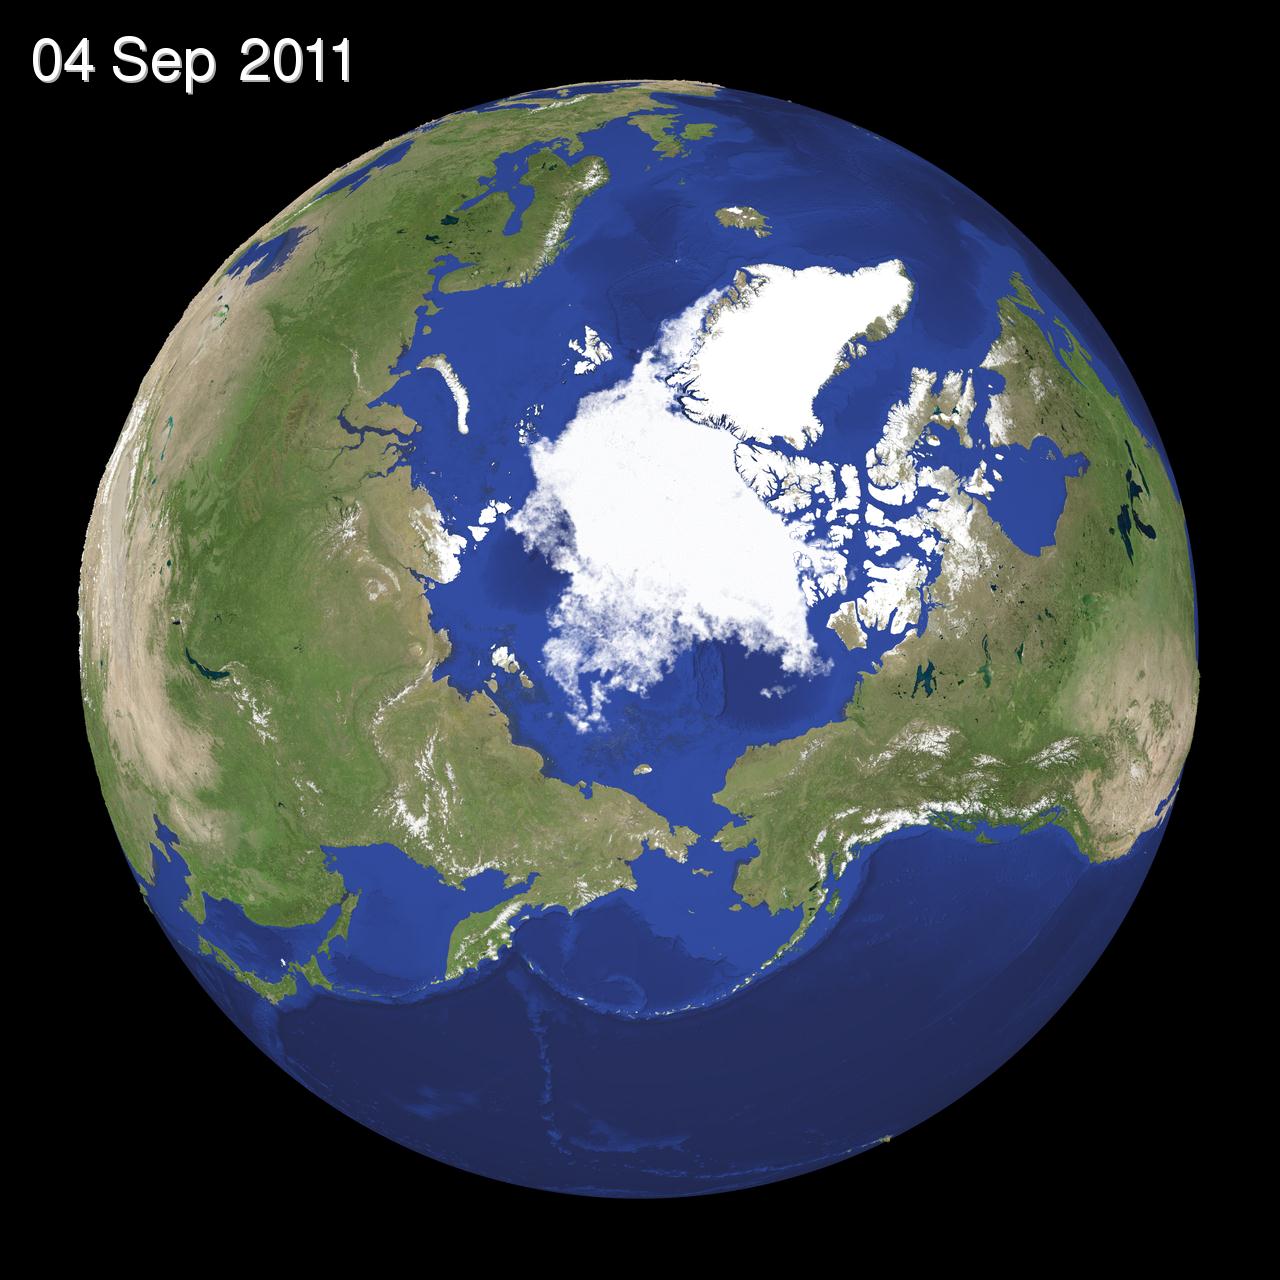
Fig 3: Satellite Generated Image of Sea Ice in the Arctic(Click to expand)
Figure 2 shows the progression of the ice extent in the Arctic Sea. Currently, ice coverage for the entire arctic sea is 4,200,000 km2, which is almost the same as the lowest area observed ever observed. The lowest area ever observed in recorded history was 4,190,000 km2 in 2007 for the same period. The Arctic ice still shows a trend of recession, receding by 200,000 km2 last week. Looking at the various progressions of the ice extent in the western hemisphere (Figure 2b) and eastern hemisphere (Figure 2c), the west which shows almost no change from the previous week's 2,500,000 km2. Meanwhile, the 1,700,000 km2 of ice coverage in the eastern hemisphere is the second lowest in history, following 1,600,000 km2 observed during the same period in 2007.
Figure 3 shows a satellite generated image of the current ice extent for the Arctic. The Canadian Arctic Archipelago (right) has ice continuing to melt in the Viscount Melville Sound. However in other areas, there are no major changes in the ice extent. Ice also continues to melt along the Siberian coast (left) in the East Siberian Sea and Laptev Sea..
Sea Ice Conditions along Polar Routes
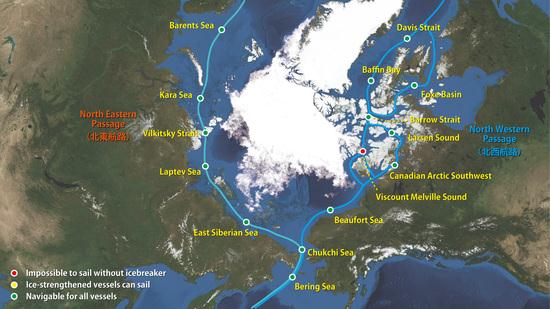
Fig. 4: Sea Ice Conditions along Northeastern/Northwestern passsages
Figure 4 shows the possibility of openings of the east route (Siberian side) and of the western route (Canadian side) of the northeast passage through the Arctic Sea. Without any major changes in conditions from last week, there are still various openings in the south side of the east and west routes. On the northwest side of the northern route, old ice in Viscount Meville Sound continues to melt. However, the routes continue to be in a state where commercial vessels would not be able to sail through without being escorted by ice-breakers.
I-SEE Model Predictions
Figure 5 is the model output from the I-SEE Engine developed by Weathernews for forecasting sea ice. Looking at upcoming changes for next week, we predict that ice to reach back out steadily into the East Siberian Sea. Ice the Arctic Sea has continued to recede until now, but we expect the ice to shift from increased melting to freezing from here on.
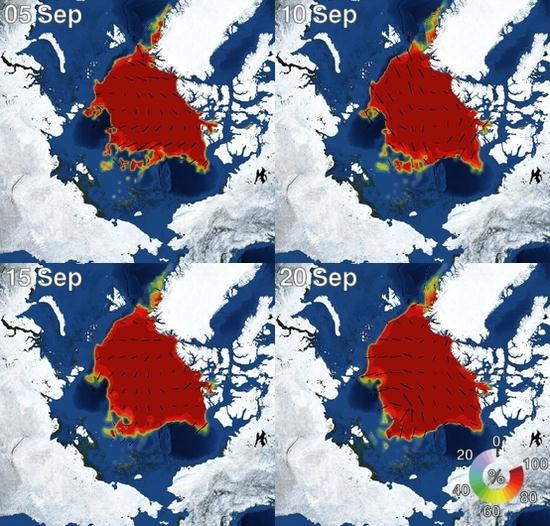
Fig 5: Sea Ice Prediction for the Arctic based on model data