2011.09.13
2011 GIC Weekly Report Vol.6
Sea Ice Extent Expanding Again
Topics of the Week
In last week’s report, we shared our prediction for the Arctic sea ice extent to shift from melting/receding to freezing/expanding. Figure 1 illustrates the changes in the sea ice from then until now. The rate of reduction is actually greater than predicted last week, and the sea ice has only come close to the record minimum coverage observed in 2007 but not exceeded it. However, because we can see a trend of ice coverage increasing from 9 September, the possibility of further reduction is expected to be low. If the sea ice coverage continues to increase, this year’s minimum coverage will be 3.97 million km2 as observed on the 9th, making it the second lowest area observed in history.
Currently, both the northeast and northwest passages of the Polar Route continue in an opened state but with ice increasing, ice along the route will spread, too. Both routes are expected to be closed from around late September to early October.
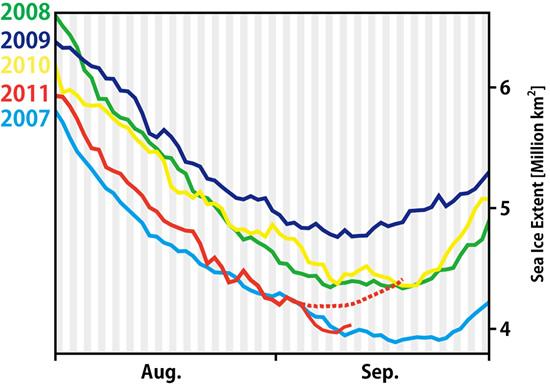
Fig.1:Progression of Sea Ice Extents from 2007〜2011. Solid lines represent actual conditions. Dotted line is prediction analysis as of 6 Sep.
Sea Ice Extent
|
Arctic Western Arctic Eastern Arctic |
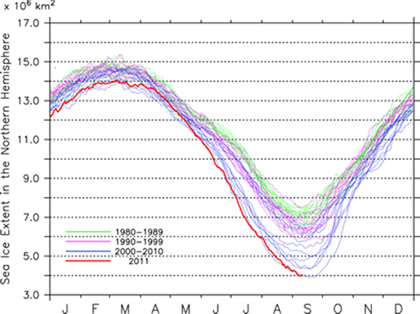
Figure 2a-2c. Sea ice extent of the entire Arctic(2a), western Arctic(2b), and eastern Arctic(2c).(Click to expand)
Figure 2 illustrates the progression of the sea ice extent in the Arctic. The sea ice extent for the entire Arctic Sea reached a minimum of 3.97 million km2 as of 9 September, and is at 4 million km2 as of 11 September almost the same as the extent for the same period in 2007 which is the lowest ever seen. The sea ice extent in the Western Hemisphere (Fig. 2) reached its lowest point in August with 2.30 million km2, which is the second lowest following 2.26 million km2 observed last year. Meanwhile in the Eastern Hemisphere, the ice extent reached a minimum of 1.65 million km2, which is also the second lowest ever seen after the record 1.5 million km2 observed during the same period in 2007.
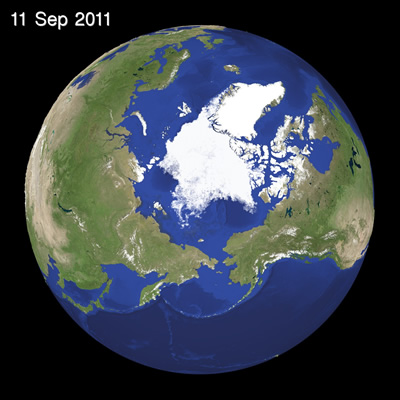
Figure 3 illustrates the current sea ice extent in the Arctic Sea. The Siberian Coast seen on the left side of the illustration shows a trend of shrinkage up to last week. However, it is clear that the ice has started to reaching outward over the last 2~3 days. The Canadian Arctic Archipelago on the right side of the illustration shows no change in particular from last week.
Sea Ice Conditions along Polar Routes
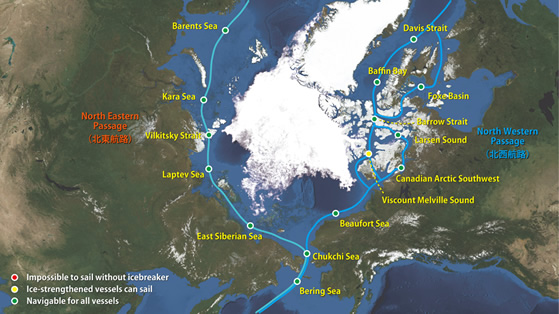
Fig. 4: Sea Ice Conditions along Northeastern/Northwestern passsages
Figure 4 shows possible openings on the northeast (Siberian side) and northwest (Canadian side) of the passage. Although there is a trend of increasing ice, there is no major change in the state of sea ice, so the southern route of the northwest and northeast passages remain open. On the northern route of the northwest passage, the sea ice concentration in Viscount Melville Sound has reduced by 1/10~3/10, and the passage went from red status (ice-breaker escorts required) to yellow (transit possible for ice-strengthened vessels.) However, the route is not yet completely open.
I-SEE Model Predictions
Figure 5 is the prediction model output from Weathernews’ I-See Engine. The sea ice in the Arctic is currently at its minimum level, but we predict that it will gradually progress outward at various points around the North Pole from here. Sea ice along the northeast passage will still be at levels low enough to for the passage to remain navigability for a while longer. However, we expect to see enough ice reappear on the Siberian Coast to close the Polar Route by the end of September.
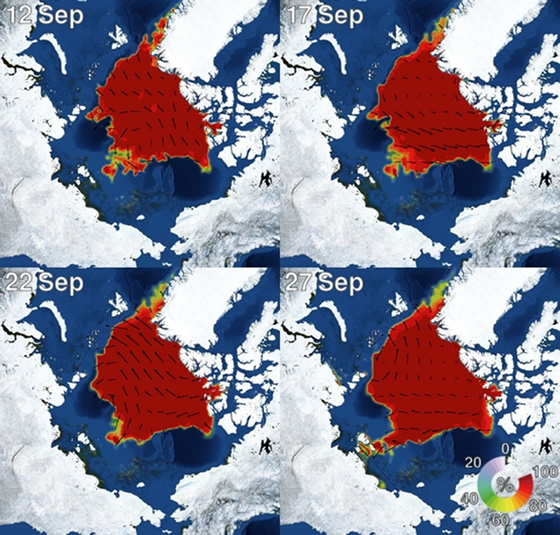
Fig 5: Forecast from Sea Ice Prediction model (Weathernews I-See Engine)


